
Sports
Celtics Fall in Houston: Start With the Fast-Break Gap
Boston’s winning streak ended in Houston. The box score offers useful questions about transition defense—and a warning about adding up overlapping statistics.
Following the Celtics should leave room for both loyalty and arithmetic. A loss invites plenty of instant explanations: effort, fatigue, the rotation, the universe’s apparently unreasonable failure to prefer Boston. The useful exercise is finding which questions the published numbers actually help answer.
Houston beat Boston 109–93 on November 2, ending the Celtics’ five-game winning streak and leaving them 5–2. NBA’s game recap.
This is analysis of the published game data, rather than a firsthand account from the arena. The result is settled. The explanation deserves a little more care.
Start with the route to the basket
Houston led fast-break scoring 18–2 and points in the paint 50–34. Official NBA game data.
Both are 16-point gaps, matching the final margin. That coincidence is interesting, but it is not permission to add them together and announce that two separate failures cost Boston 32 points. A fast-break basket can also be scored in the paint. These are overlapping descriptions of scoring, not necessarily separate piles of points.
The more useful question is what produced the opportunities. A transition chance might begin with a turnover, a missed shot, an opponent securing the rebound or a slow recovery. The totals alone do not allocate responsibility among those possibilities. Identifying a particular player or tactical decision as the cause requires possession-level evidence.
For a Celtics-focused reading, that makes defensive recovery a reasonable place to investigate. It does not establish that every conceded basket had the same explanation. “Get back” is a helpful instruction; it is a fairly incomplete scouting report.
Shooting percentages describe a result
Boston shot 38.6% from the field; Houston shot 54.4%. The Celtics’ official statistical summary.
A large difference in conversion immediately raises another set of questions. Were the shots well defended? Which attempts were near the rim? Which were difficult shots a team would rather avoid? And how many good opportunities simply failed to fall?
A percentage records what went in. It does not independently grade the decisions that created each attempt. That is why an explanation based only on “make more shots” can be technically correct and analytically unhelpful. The better distinction is between execution that can improve and choices worth changing.
Turn the questions into a watch list
For the next Boston game, three things merit attention: how quickly players recover after an unsuccessful possession, whether the opponent gets repeated clean routes toward the basket, and whether Boston’s own attempts come from deliberate advantages or improvised difficulty.
That is a watch list, not a prediction. One game cannot establish that a pattern will persist, and a subsequent win would not automatically show that every underlying issue had disappeared. Consistency needs more than a conveniently chosen pair of results.
The rewarding part of being a fan is caring enough to look closely. Houston earned this result. Boston’s next job is to provide a better answer on the floor. The rest of us can improve the conversation by keeping the score, the evidence and the explanation in their proper places.
More to explore
Sports
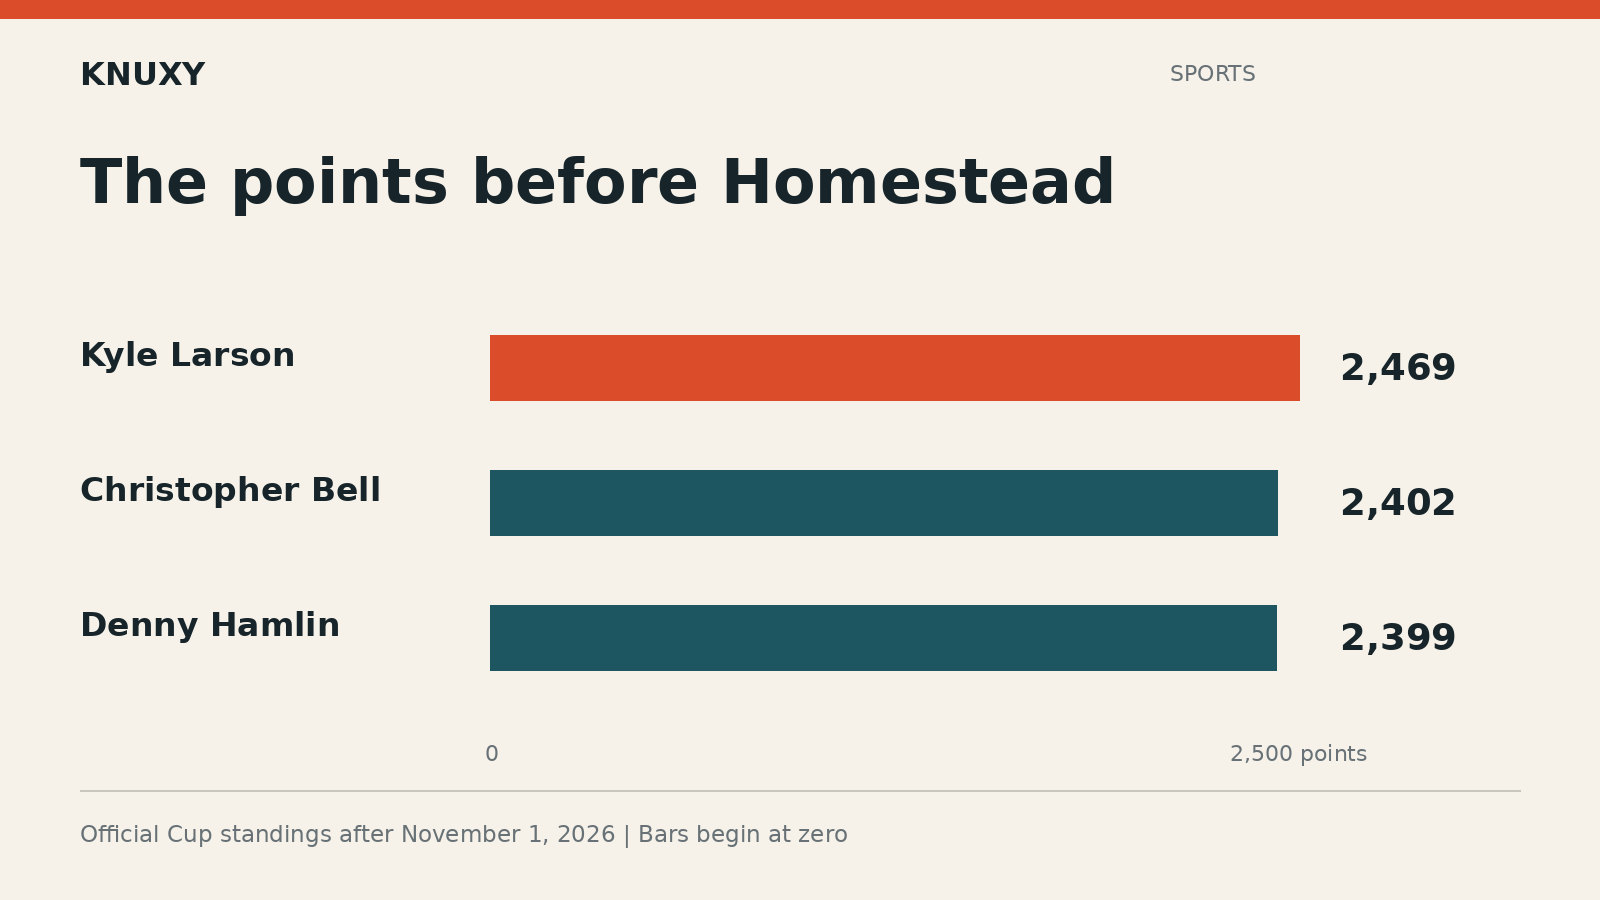
NASCAR’s Homestead Finale: The Title Can Be Decided Before the Finish
Kyle Larson leads the Cup standings by 67 points. The November 8 finale rewards watching stage points as closely as the checkered flag.
Sports
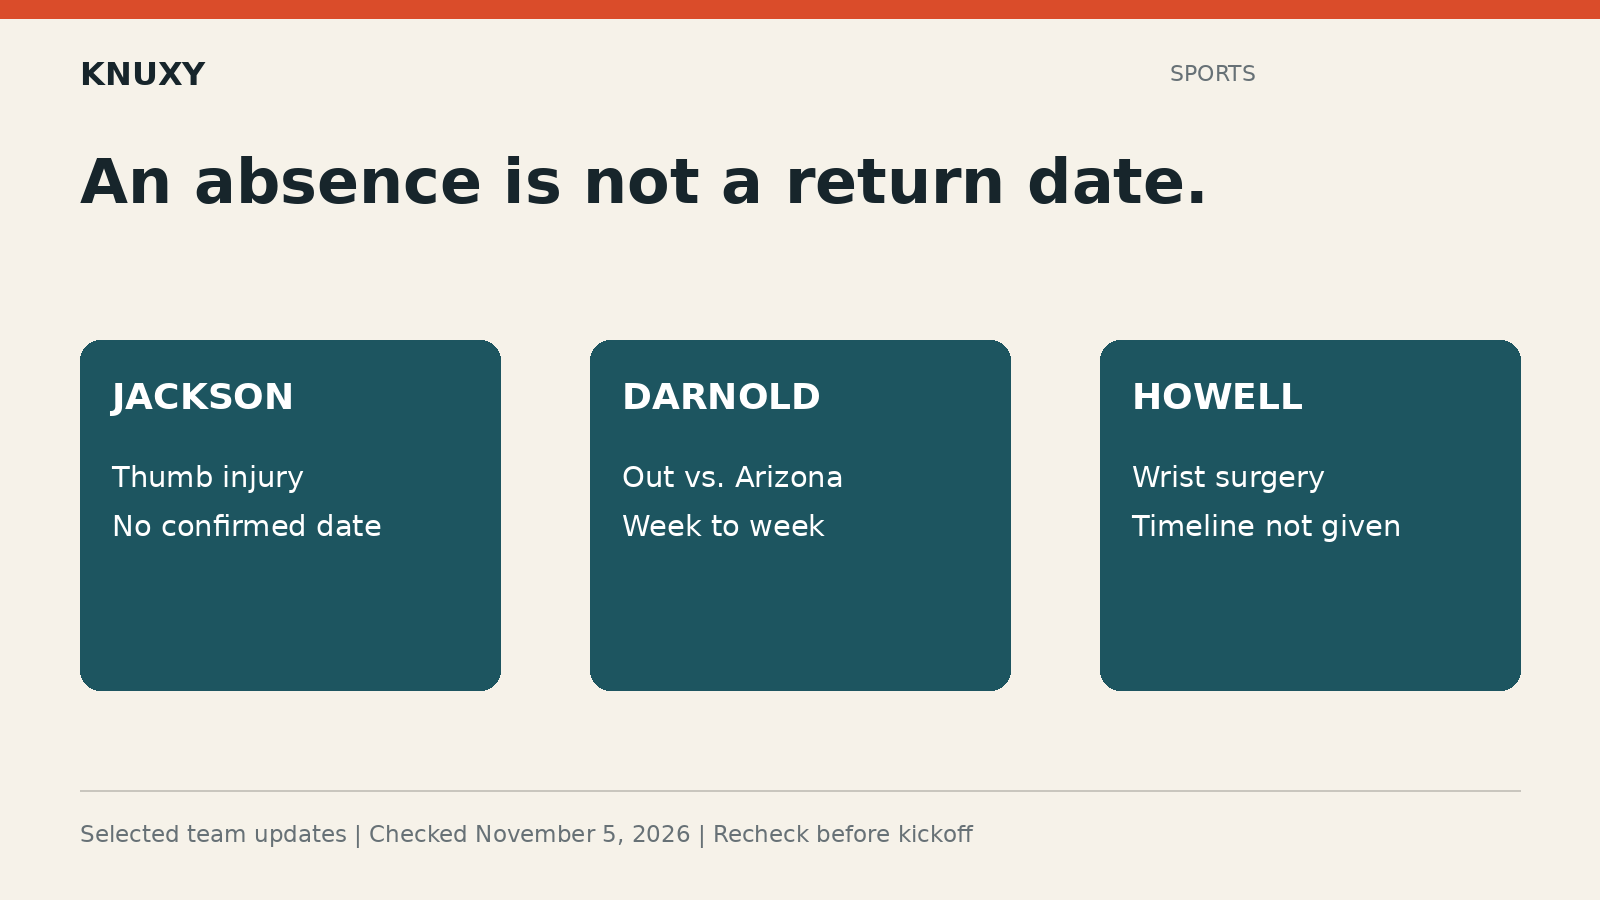
NFL Week 9 Injuries: Who Is Out, and What Recovery Timelines Really Say
Jackson, Darnold, Huntley and Howell illustrate why confirmed absences, practice reports and recovery forecasts need separate columns.
US News
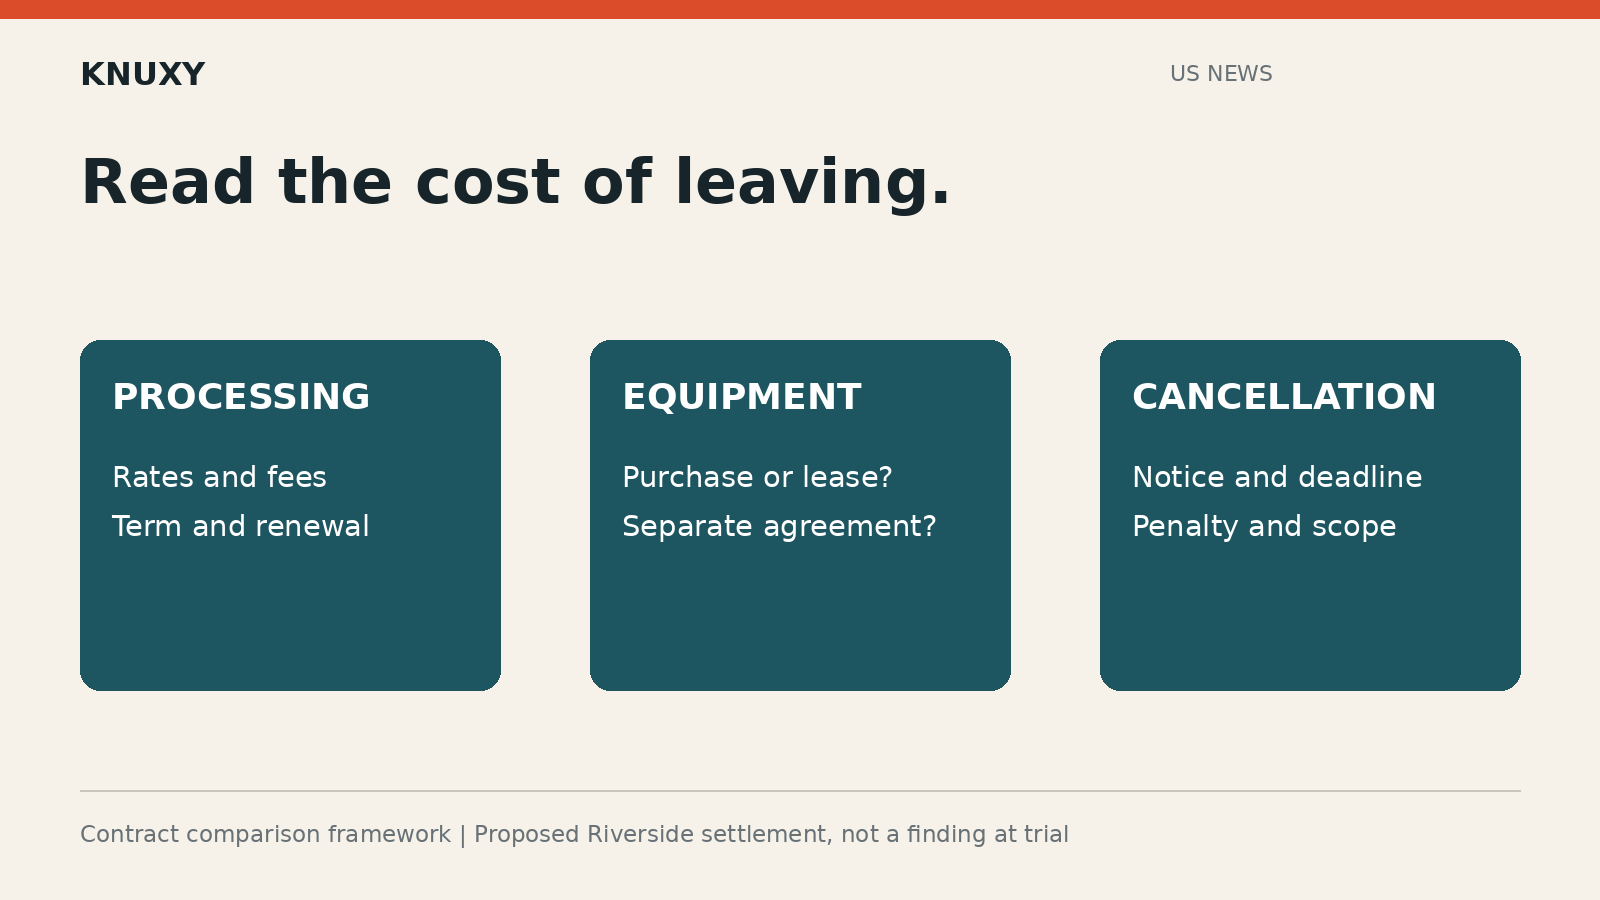
The Payment-Processing Deal That Made Leaving the Expensive Part
A proposed FTC and Washington settlement targets alleged savings and cancellation deception. Here is what small businesses should check.